From image to decision: digital asset management of concrete structures in practice
Belgium has thousands of concrete structures that are gradually reaching the end of their design life: bridges, quay walls, tunnels, industrial installations. At the same time, monitoring them properly is becoming harder. In a recent talk, Tim Soetens, co-CEO and co-founder of Sanacon, put one question at the centre: how do we move from scattered inspection images to well-founded decisions? Here are the key takeaways.
The challenge: more assets, fewer hands
Asset managers today face a growing pile of challenges:
- The number of structures that need maintenance keeps rising.
- Damage becomes more intense as structures age.
- Infrastructure works cause more and more disruption to people and society.
- Fewer people are available on the labour market for inspection and maintenance.
- Budgets are under pressure.
On top of that comes a less visible problem: lost knowledge. Asset managers regularly tell us things like: “An inspection was done, somewhere around 2012 or 2013, but we no longer have anything from it.” Or: “Cores were drilled and the report exists, but we no longer know where each core was taken.” In practice, a measurement without a location is a lost measurement.
More data, but well managed
More data brings more insight, but only if the data flow is well managed and leads to sound advice. At Sanacon, we therefore work from four principles:
- Full coverage. No more spot-check visual inspections, but a complete picture of the structure using drones. This makes us less dependent on the individual operator.
- Automated processing. Getting from raw images and measurements to usable results as quickly as possible.
- Exact location. Every raw measurement and every analysis result is linked to its precise position on the structure.
- Past, present and future. Comparing today’s inspections with earlier ones, as the basis for predictive asset management.
Case study: a concrete structure in the Scheldt
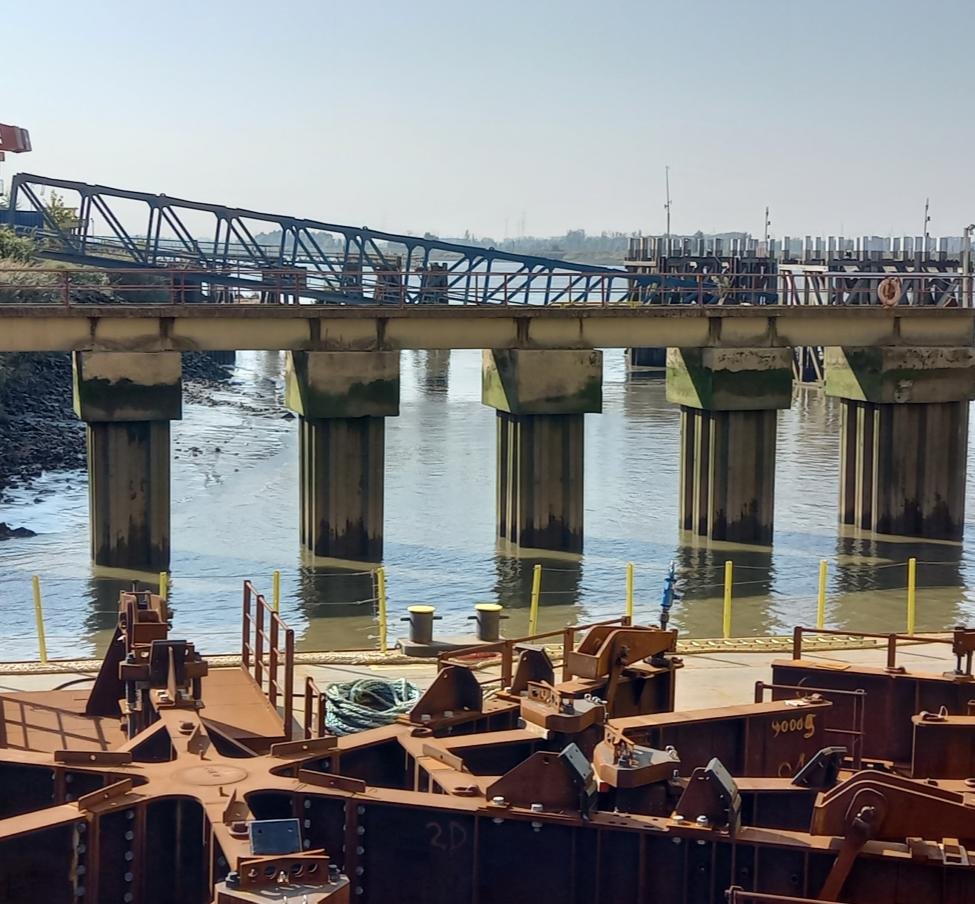
To show what this looks like in practice, we presented a recent project: a reinforced concrete structure in the Scheldt, built in 1980.
The client’s initial question was limited: map the longitudinal and transverse reinforcement so that the risk of drilling through rebar when installing new rails would be kept to a minimum. Carbonation and chlorides could possibly be tested as well.
We proposed a three-step approach with one common thread: bringing all data together in a single digital model.
Step 1: visual inspection by drone
The entire structure was captured using a combination of two drones (DJI M4E and Flyability ELIOS 3). The tide had to be taken into account: flights were only possible at low water. Lighting conditions under the structure also had a major impact on image quality.
In total, 444 images were processed into a detailed 3D model. This lets us answer questions such as: where is damage visible and where is it not? Is the damage local, or do we see patterns?
Step 2: measurements and sampling
Together with rope access technicians, we carried out core drilling and concrete cover measurements. The carbonation depth and chloride ingress were then determined in the lab.
A notable part of the project was the use of AI to determine carbonation depth on the cores. On one of the cores, the AI measurement gave an average of 8.7 mm (standard deviation 2.7 mm, based on 193 measurement lines). The manual measurement came to an average of 10 mm with a standard deviation of 3 mm. This is still work in progress, but the results are promising: AI speeds things up, the engineer remains responsible.
All measurement data came together in DIMCOST®: drone images, cover measurements, cores and lab results, each linked to its exact location on the structure. No more cores or measurements without a location.
Step 3: analysis and advice
Based on this linked data, we calculated the residual service life for each zone of the structure. The result gives a clear picture:
| Zone | Avg. concrete cover | Avg. carbonation depth | Probability of failure, carbonation | Probability of failure, chlorides |
|---|---|---|---|---|
| Caissons, side face | 36 mm | 3 mm | 0% | 44% |
| Crane beam, underside | 30 mm | 9 mm | 0% | 6% |
| Crane beam, side face | 42 mm | 15 mm | 0% | 19% |
| Average | 38 mm | 9 mm | 2% | 34% |
Probability of failure: likelihood of the reinforcement being affected at the structure’s current age (46 years).
The conclusion is clear: carbonation is not an issue for this structure, but chlorides are. The side faces of the caissons in particular need attention. Thanks to the 3D model, the asset manager sees a condition score for each measurement point in the right place, and can make targeted decisions on where repairs are needed and what they will cost.
Conclusion: reports gathering dust are a thing of the past
The future of asset management is digital, visual and predictive. In this case, that came together in four steps:
- Full coverage: 444 drone images, processed into a 3D model of the entire structure. A complete overview instead of random samples.
- Automated processing: AI analysis of carbonation depth, checked against manual measurements.
- Exact location: cores and cover measurements linked to their position in the model.
- Past, present and future: carbonation and chlorides determine the residual service life and repair advice, for well-founded decisions on long-term costs.
Do you manage concrete structures and want to know their residual service life? Get in touch with Sanacon or find out more about DIMCOST®.